

Just look around, so you will be able to understand that data is everywhere.
For example, Human beings can store only a limited amount of information. Nowadays technologies are improving day by day as a result just one click on your mobile phone will generate more data than we know.
So, the data will refer to facts as well as statistics that are collected together for analysis or reference.
The data can be generated from different sources.
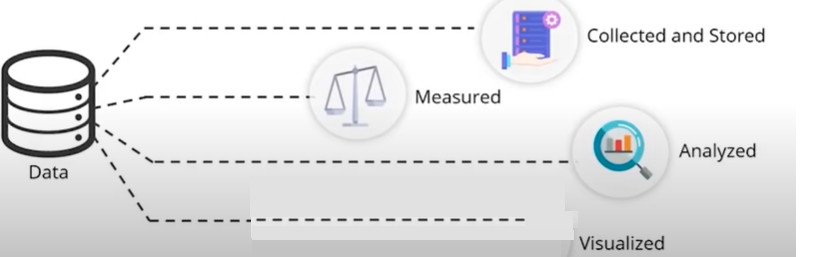
These generated data are
These steps are done using statistical models and graphs.
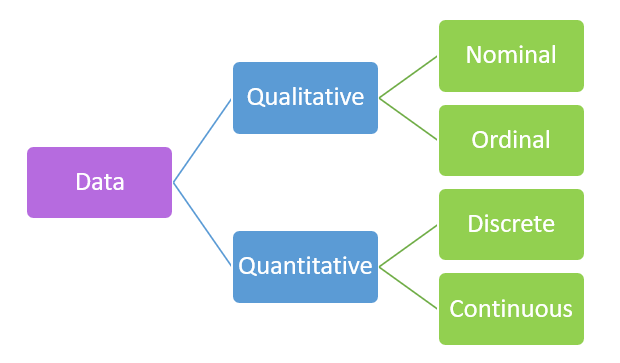
Data is mainly divided into two
Qualitative data mainly deals with characteristics as well as descriptors that can’t be easily measured but that can be observed subjectively.
Qualitative data is further divided into nominal data and ordinal data.
Nominal data is any sort of data that doesn’t have any order or ranking.
Two examples of nominal data
1. Gender
2. Race
1. Gender
An example of nominal data is gender. If we are taking the example, of gender, it is very well understood that there is no ranking. There are only two categories that are male and female and there is no kind of ordering like 1, 2, etc
2. Race
The race is another example of nominal data where it doesn’t have any order or ranking.
It is an ordered series of information. If data is ordered that kind of data is known as ordinal data.
An example of ordinal data
Raju is a businessman and one day he went to a hotel and all his information is stored in the form of a customer ID. That means he is represented with a customer ID. Before he left the hotel he wanted to rate their service. He can rate their service as either good or average. Like Raju, the hotel management will have a record of other customers who visited their hotel with their ratings.
If any data have some sort of order that kind of data is called ordinal data.
There are two types of quantitative data:
1. discrete data
2.continuous data
Discrete data is also known as categorical data. This is a kind of data that can hold a finite number of possible values.
Example for discrete data:
The number of students in a music class is an example of discrete data because the number of students in the music class is a finite number.
Continuous data is a kind of data that can hold an infinite number of possible values.
Example for continuous data
The weight of a person is the best example of continuous data. Suppose Seetha’s weight is 54kg or 54.1 kgs or it can be 54.00 one kgs this shows there is an infinite number of possible values. This data is known as continuous data.
A discrete variable is also known as a categorical variable which means it can hold values of different categories.
For example: suppose you have a variable called “MESSAGE” and there are mainly two types of values that this variable {message} can hold. That means either the message can be a spam message or a nonspam message. So here the variable MESSAGE is called a categorical variable because it represents different categories of data.
It can store an infinite number of values.
For example, a weight of a person can be denoted as a continuous variable. Suppose there is a variable called “WEIGHT” and it can store an infinite number of possible values hence the variable WEIGHT is called a continuous variable.
It is an area of applied mathematics that is concerned with the collection of data, analysis of data, interpretation, and presentation.
Statistical methods are used in order to visualize data, collect data, and to interpret data.
The area of mathematics helps mainly to understand how data can be used to solve very complex problems.
Examples of some problems that can be solved using statistics.
Example 1
Xyz is a very famous company and last month they invented a new drug that may cure tuberculosis.
How do we check the effectiveness of the drug?
Solution: This can be solved using statistics.
The very first step is to create a test that will help to understand the effectiveness of the drug which is invented.
EXAMPLE 2
Rahul and Rema are best friends. Both are watching football. Suddenly Rahul offers a bet for Rema regarding which team is going to win the match either blue or red.
It is another problem that comes under statistics. This problem can be solved using statistics.
Data scientists mainly use statistics in order to