Data science is all about extracting useful insights from the data which are collected from different sources. These useful insights are extracted by a data scientist using different statistical tools and by using some programming languages.
So, in this module let us discuss various data science tools, their features as well as their benefits which are used by data scientists in order to extract useful information and insights from the collected data.
As we all know data scientists are the ones who will extract useful insights from the data for improving the business of a particular company. They are will do a lot of things such as data analysis, data cleaning, extracting useful insights, and communicating the findings with their team members as well as with the higher authority to improve the business. In order to do all these things, data science tools and some programming languages are used by data scientists to make the process easier. What are the tools used by data scientists, and what are their key features and their benefits all these things will be discussed more clearly in this module? Mainly these tools are used for data analysis and for providing predictions about the business to the higher authority.
So many data science tools are used by each and every data scientist while working in a company for improving their business. But some tools are used by the data scientists most frequently.
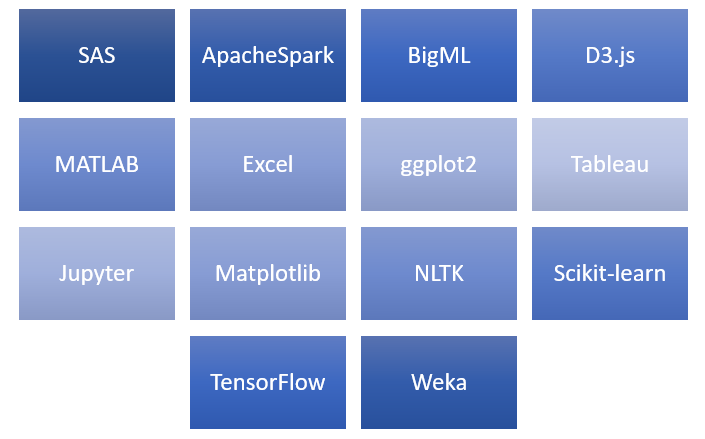
Frequently used data science tools by a data scientists
SAS, ApacheSpark, BigML,D3.js, MATLAB, Excel,ggplot2, Tableau, Jupyter, Matplotlib, NLTK, Scikit-learn, TensorFlow, Weka are the most frequently used data science tools which is used by data scientists.
SAS is a data science tool that is mainly and perfectly designed for statistical operations. A vast number of organizations are using SAS for analyzing data. For statistical modeling data, scientists mainly use the base SAS programming language.
Many statistical libraries are provided by the SAS for data scientists, not only libraries but also a lot of tools for analyzing the data, data modeling, and also for data organizing. SAS is a very powerful and strong tool and provides great support for the companies that use SAS. But it is seen that only large and multi-national companies will use SAS because this tool is very expensive so only large companies can afford it. The up-gradation which is available in this tool is also very expensive.
1. The ability for analysing data is very strong
2. For the 4th generation programming language this tool is very flexible.
3. Availability of SAS studio
4. Algorithms for data encryptions are available.
5. Different types of data formats are very well supported.
6. Availability of report output format
7. Management
Apache Spark or simply spark is the most frequently used data science tool. It is an analytics engine that is very powerful and it is designed in such a way that it can handle all types of the batch as well as stream processing.
When we are comparing MapReduce with Spark it is very much clear that Spark is far better and faster than MapReduce. A lot of machine learning APIs are present in Apache Spark which leads to powerful predictions from the obtained data. Streaming data is handled very efficiently by this tool. Some tools will only handle historical data that too in batches but this tool is very powerful and it can handle real-time data very efficiently.
1. Advanced Analytics
2. Real-Time Stream Processing
3. False Tolerance
4. Lazy type of evaluation
5. Reusability
6. High Speed
BigML is another popular tool that is used in data science. In order to process machine learning algorithms, BigML will provide a completely interactable as well as cloud-based GUI environment.
A standardized software is provided by the BigML using cloud computing for meeting the company requirements. One of the main specialties of BigML is it specializes in predictive modeling. Many machine learning algorithms are used by BigML for example time series forecasting, clustering, classification, etc {link to ml}
D3.js tool is completely based on Javascript. Animated transactions can be done using the D3.js tool. If a data scientist is working on a device that is IOT based where a client-side interaction, as well as visualization to process data, is required then the D3.js tool will be very useful.
Illustrations and transitory visualizations can be made by combining D3.js with CSS which will help a data scientist in order to implement the customized types of graphs on the web pages. In IoT, client-side interactions can be made with the help of the D3.js tool.
1. Completly based on Javascript
2. Animated Transactions can be created
3. Used in IoT for client-side interactions
4. Interactive visualization can be made
5. Open source
This data science tool is mainly used for processing data that has more mathematical information. Statistical modeling, matrix functions, and algorithmic implementation of data which is collected from different sources are facilitated by the tool named MATLAB. Mostly this tool is used in scientific disciplines, for stimulating fuzzy logic as well as neural networks.
Powerful visualizations can be created by using the MATLAB graphics library. It is also used for processing images as well as signals. This is the most powerful tool because it can solve almost all sorts of problems right from data cleaning. It is very much useful for deep learning as well as for solving complex mathematical operations.
1. Very easy to use
2. Errors and bugs can be fixed very easily
3. Fast
4. Display capabilities are excellent
5. It is Platform independent
It is the most commonly used data science tool. Excel tool is developed by Microsoft and it is mainly developed for spreadsheet calculations the amazing thing is nowadays it is also used for processing data, data visualization, and also for very complex calculations. One of the main disadvantages of this tool is a large amount of data calculation is not supported but powerful data visualizations and spreadsheets can be created.
Different types of formulas, tables, filters, and slicers are there within the EXCEL tool. It always provides an easy connection with the SQL and is always used for analyzing small-scale data.
1. Analyse small-scale data
2. Easy connection with SQL
3. Spread sheet calculations and visualization is done
4. For complete data analysis excel tool is used
It is a special data science tool package that is mainly used in the R programming language for advanced data visualization. In order to create illustrious visualization powerful commands are used by the ggplot2 data science tool.
Customized visualization can be created using ggplot2 by a data scientist. There are many data visualizing tools in data science but this tool is very different from other data visualizing tools and it is very efficient also. When you are using the ggplot2 tool the intractability of the graphs is boosted, text labels can be added to the data points, and we can also easily annotate our data in visualizations.
It is a data visualization software. This software package consists of powerful graphics which help to make visualizations more interactive. If the companies working field is business intelligence there the tool Tableau is used frequently. Geographical data visualization and the longitudes, as well as latitudes in the maps, can be easily plotted using Tableau. The main abilities of the tool Tableau are interfacing with databases, spreadsheets, Online Analytical Processing cubes and etc.
This tool is mainly used for helping developers who are involved in making open-source software as well as if they are experiencing interactive computing. It is an open-source tool completely based on IPython.
Julia, R, and python are the multiple languages that are supported by Jupiter. The requirements of data science are addressed mainly by Jupyter.
This tool is mainly developed for python. From the analyzed data, this tool helps in generating graphs. Matplotlib is a library for plotting and also for visualization which has been strictly developed for Python. A simple line of code is used for plotting complex graphs.
Line plot, Scatter plot, histogram, bar chart, and pie chart are the plotting techniques used by matplotlib. Using this tool vast amount of data can be handled very easily and it can be represented using graphs, charts, etc very efficiently.
Tokenization, stemming, tagging, parsing, and machine learning are the various language processing techniques and NLTK is the tool mostly used for this.
It contains more than 100 corpora, where corpora are nothing but a collection of data and it is used to construct machine learning models. This tool is specially used for text analytics and also for natural language processing tasks. Speech tagging, word segmentation, Machine Translation, and text-to-speech recognition are some of the applications of NLTK.
In order to implement machine learning algorithms mostly sci-kit learn is used. It is used for analyzing data and it is simple and easy to use compared to other data science tools.
Data pre-processing, classification, regression, clustering, and dimensionality reduction are the various machine learning features that are supported by Scikit learn. When we are using this tool it will make the usage of complex machine algorithms easy.
It is a tool with high processing ability because of that itself it has a variety of applications such as speech recognition, the discovery of drugs, language and image generation, classification of images,s, etc.
TensorFlow tool should be compulsorily known to all the data scientists who is specializing in Machine Learning. This tool can easily run on many platforms such as CPUs, GPUs, and also in TPU platforms.
The full form of this tool is Waikato Environment for Knowledge Analysis and shortly known as WEKA. This tool is a machine learning software and it is written in Java. It consists of many various types of machine learning algorithms and it is mainly used for data mining. It is also known as data mining or machine learning tools.
Compared to other data science tools Weka is less expensive. The main advantage of this tool is its availability this tool is free, and highly portable which means it can run on most modern platforms, it supports data pre-processing, clustering, regression, visualization, and selecting features.GUI and command line can be used very easily.