

Decision trees are intuitive algorithms that aim to select the best series of decisions based on the data that lead to a given outcome. They are highly flexible and can be used for both classification and regression tasks. The only difference in the usage is about the target variable.
Classification and Regression Trees (CART) are the basis for bagging, random forests, and boosting. This tutorial provides a foundation on decision trees that will lead us to explore these more complex ensemble techniques.
Classification problems: we are using the CART algorithms for classification problems and the only difference is in the output variable. In classification problems, the output will be a finite value. Which means the next day will be sunny or not.
Regression Problems: In the regression problems, we will get the output variable as an infinite value set. for example, prediction of a house price.
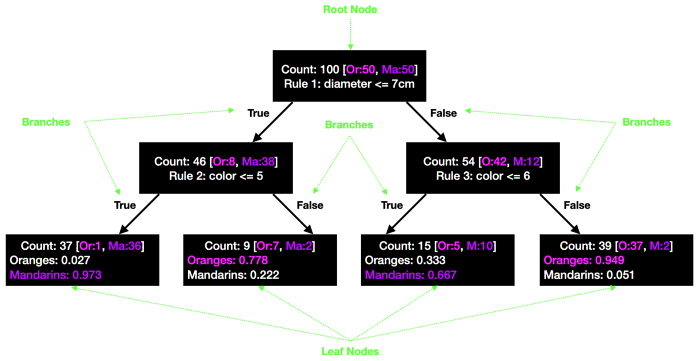
For understanding, the working of the CART considers an example as we have some oranges that are mixed with some mandarins. We need to sort them both into different categories, so we need to have some set of rules that help to categorize them.
Firstly we take the size of both as oranges are a little bigger than mandarins so we can assume the size of orange will be around 10cm whereas mandarins will be less than 7cm. Again we can consider the color of oranges will be lighter than mandarins.
So we can consider the color range from 0 to 5 for oranges. Hence we can make a tree with 3 rules which will split the oranges with mandarins.
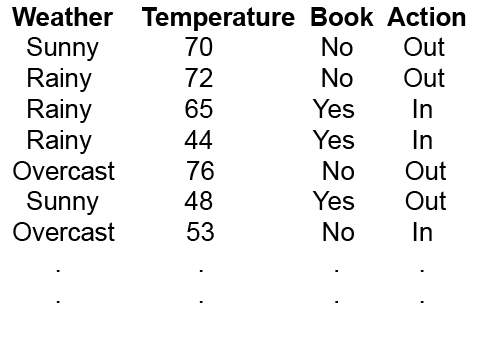
We’ll take a simple example, where we’ll decide whether we want to go out or stay in based on three criteria: the weather, the temperature, and if we have a good book or not. This fictional dataset looks like this:
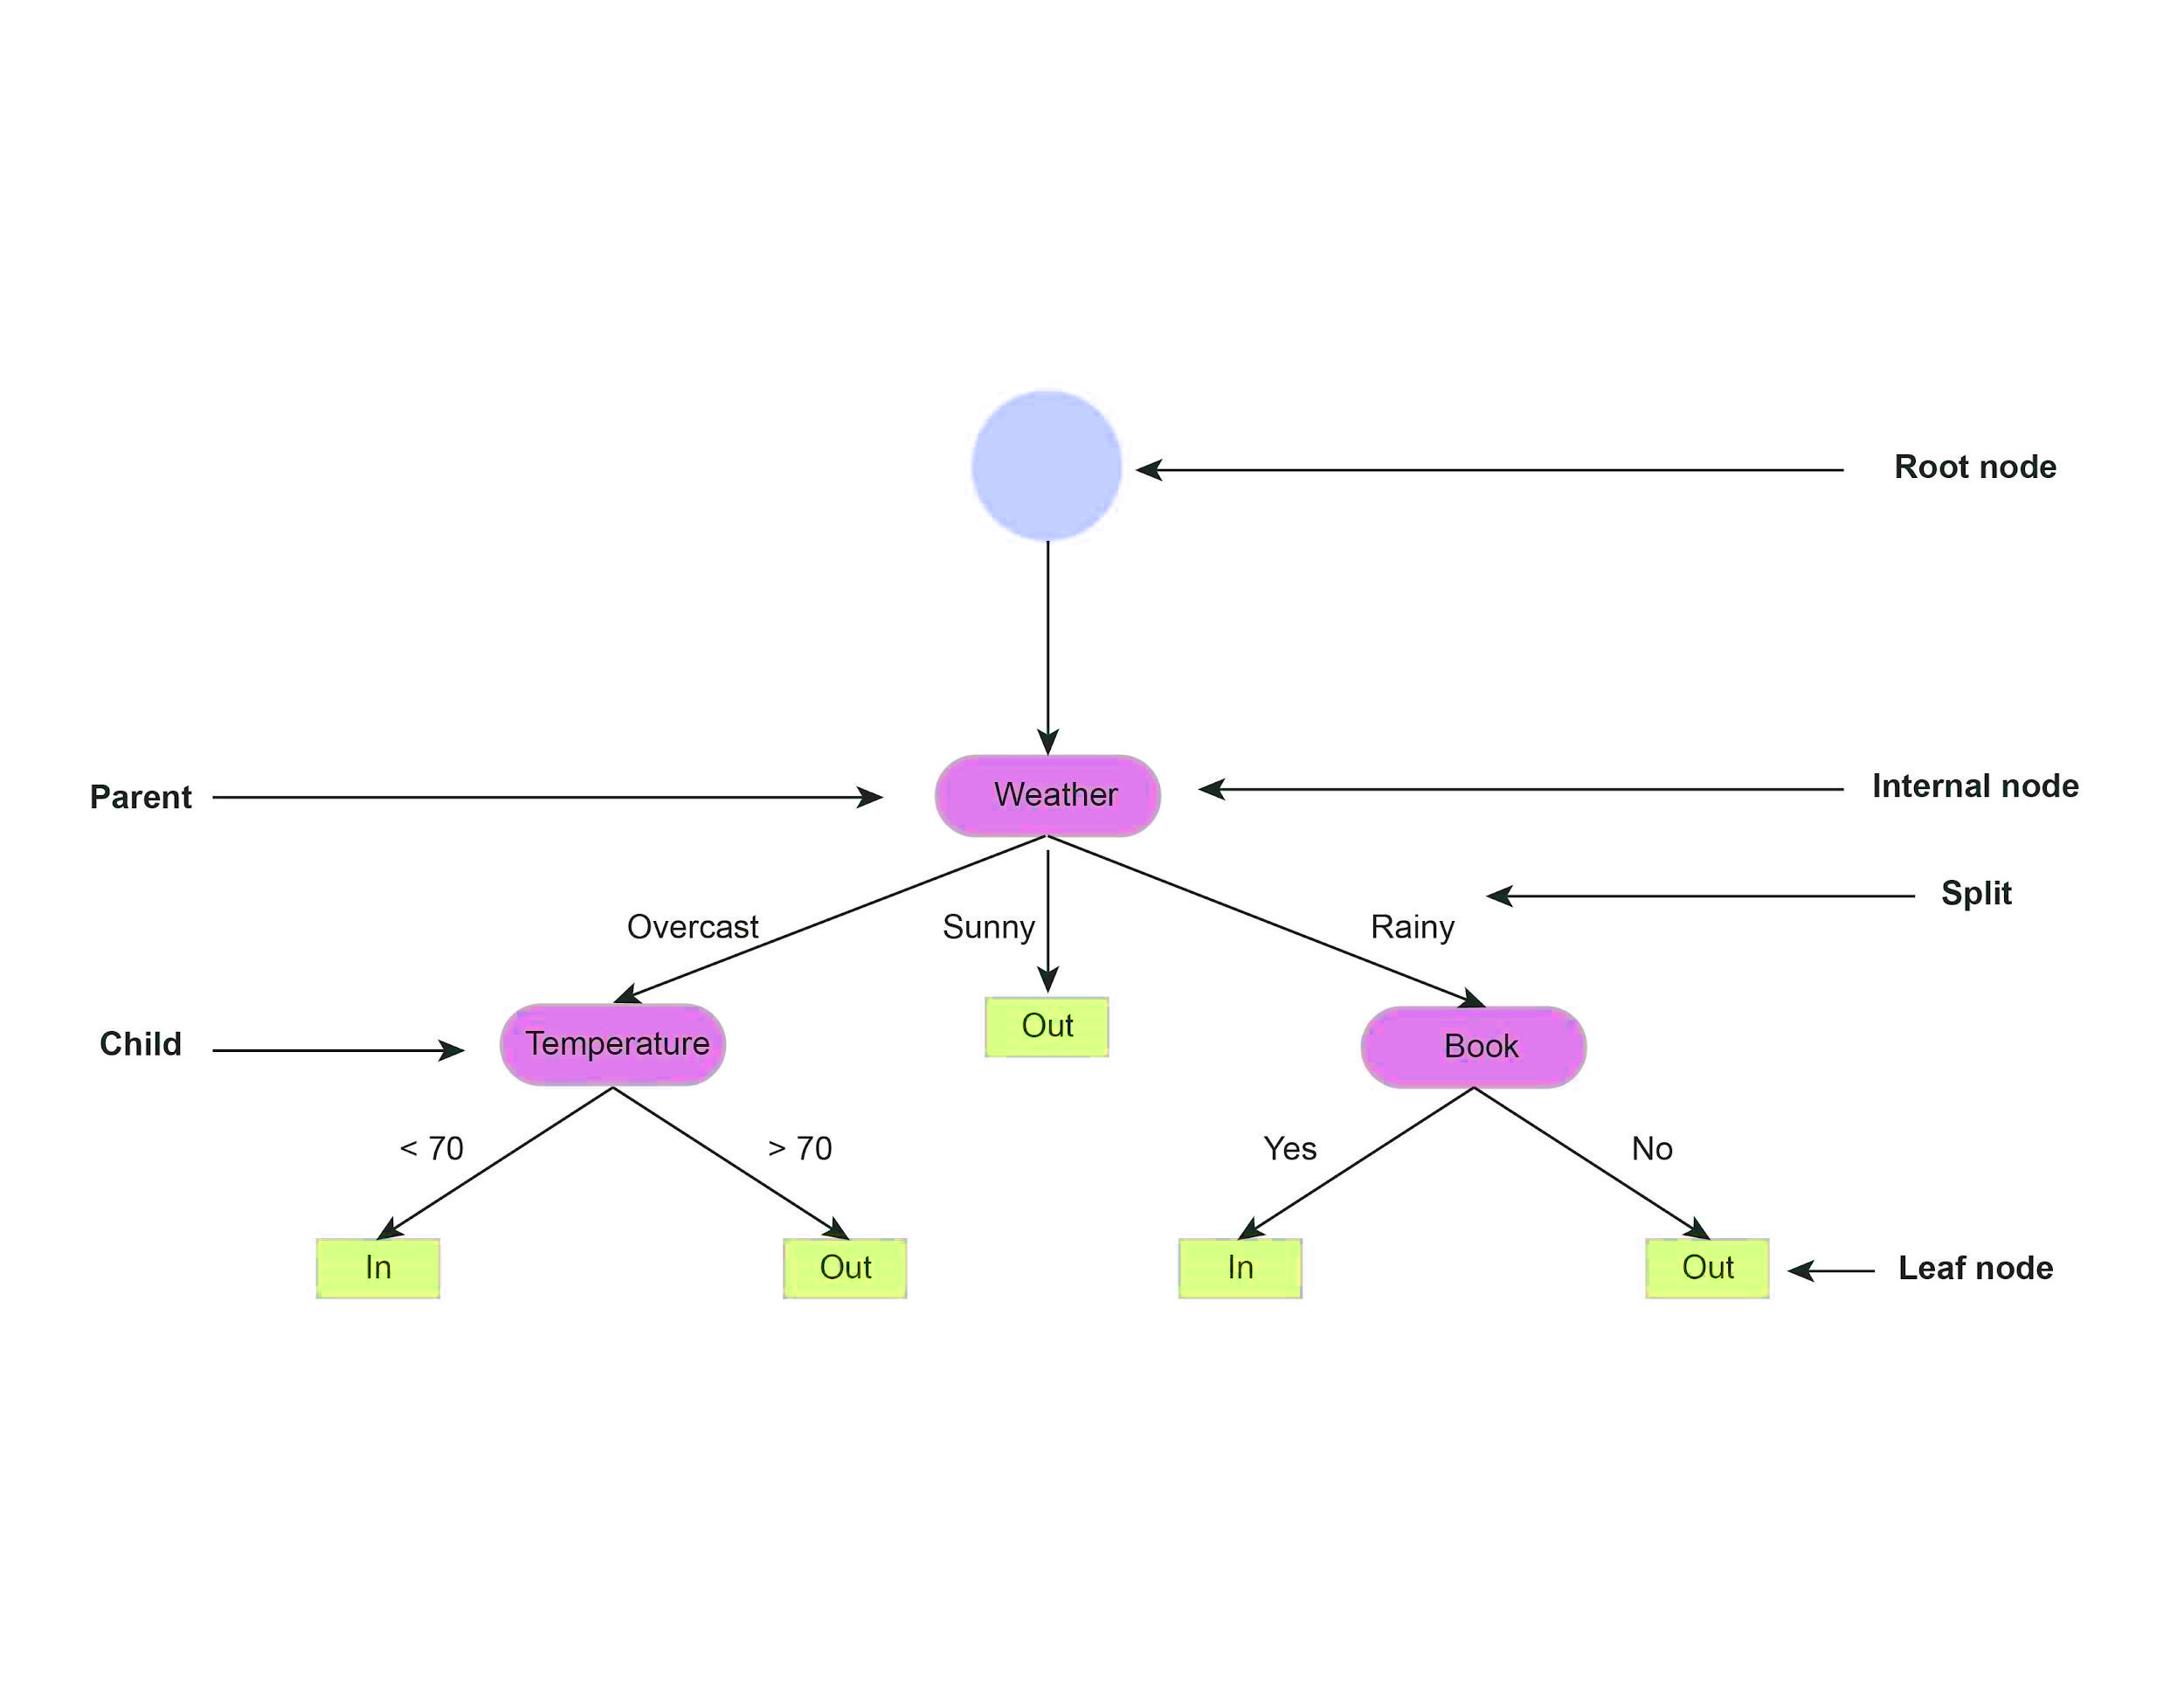
A decision tree is drawn from the root node to the leaf node, representing the result: whether we stayed in or went out. Additional features that were considered in the decision-making process are known as internal nodes.
We can describe relationships between nodes. The parent node is the node preceding the child node in the decision process. Nodes are split into branches based on decision rules that the model learns in the training process.
From this simple example, we have already identified the set of rules that lead to specific outcomes. However, the goal of CART is to a) learn an appropriate tree structure and b) learn these decision rules.
Because we have three different features from the root node, we can split the tree based on weather, temperature, or book. The key question is to determine how the algorithm chooses the order in which features are split.
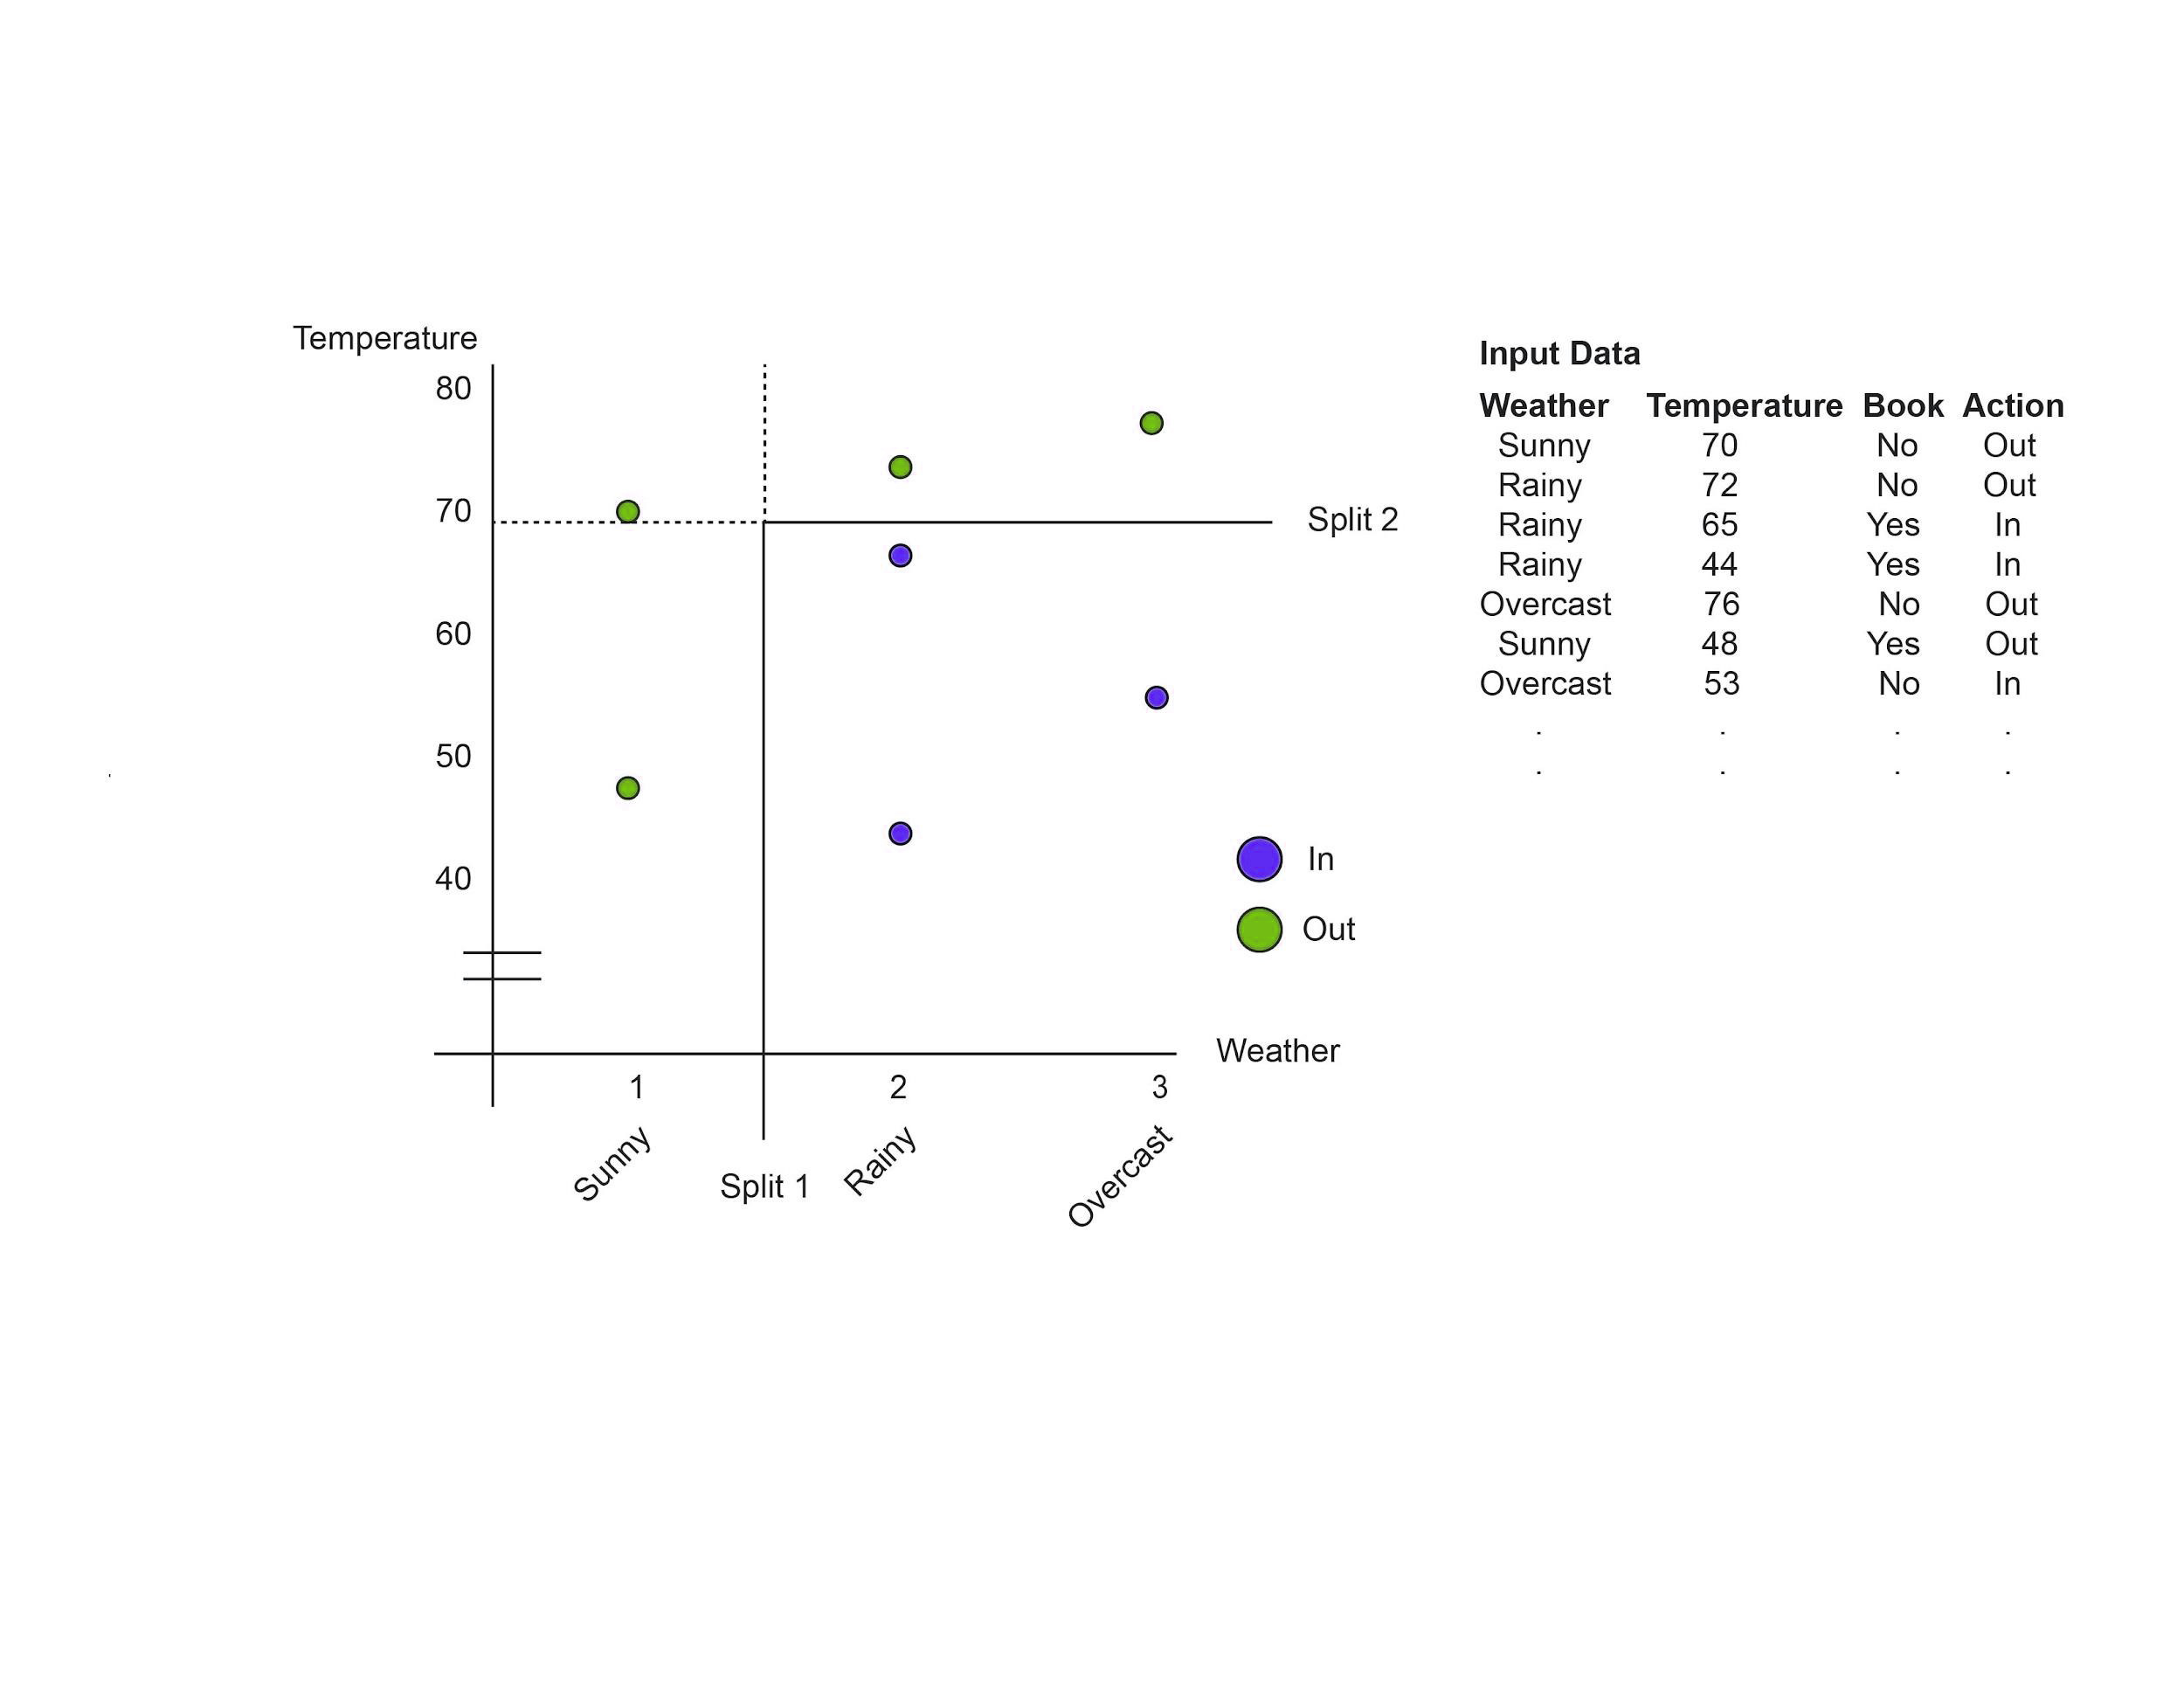
In CART, we create three initial splits based on each feature. Then, we evaluate how well the split either minimized the error or improved the prediction. This process of branch splitting is iterated for further subdivisions until we reach the leaf node.
The example above shows the split between the Weather and Temperature features. The algorithm first splits between Sunny and Rainy in the Weather axis because that results in the best separation between the In and Out classes. Then, on the Temperature axis, 70 degrees looks like the best temperature to split the two categories.
In regression trees, the mean squared error is used to determine split quality across all branches.

Where the pi is a fraction of items of a class.
However, accuracy is not a good measure in classification trees to determine split quality, especially with imbalanced data, where overall model accuracy can lead to skewed results. Instead, we can use two alternative metrics:
entropy and information gain. These alternative metrics tell the model how a split separates classes. Entropy is almost the same as Gini impurity but uses a different formula.

For making a good split we have to understand all the above things and always keep in mind that the split with the lowest entropy is the best. Likewise, check the entropy of two child nodes, if it is not higher than the parent, stop splitting.
The main issue with decision trees is that they are prone to overfitting if they create complex trees unique to a given dataset. Thus, it is important to tell the model when to stop splitting.
This hyperparameter is called the maximum depth, and it refers to the longest path your model can have from the root to the leaf node.
While we can tell the model to stop splitting, we can also backtrack and prune branches that lower the split quality. Tree pruning is equivalent to regularization, and alpha is the hyperparameter used to weigh nodes and tell the model to remove branches containing little information.