

We’ll now cover an essential family of machine learning algorithms that have many practical use-cases from search engines to patient diagnoses: clustering. So we need to discuss clustering and the types of clustering.
A machine learning expert's aim is to make a model which gives accurate predictions. We already discussed that these algorithms are of two types in general that are
1. Supervised machine learning
2. Unsupervised machine learning
K means clustering comes under an unsupervised learning algorithm, which means there will not be labeled data to train the model.
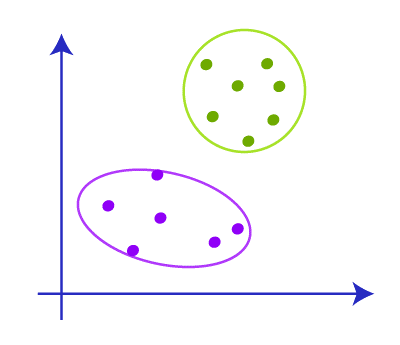
Clustering aims to group different data points into sets that are similar to each other from other groups. Similarity, in the context of clustering, is defined by the distance between two data points in a coordinate system. If we are interested in assigning labels to specific data points, this is a classification problem. However, clustering can also be an unsupervised learning problem, depending on the application.
Various types of clustering are
1. Hierarchical clustering: In hierarchical clustering, it uses a tree-like structure for the clustering.
2. Partitioning clustering: In partitioning clusters, the data points are divided into partitions.
Again the hierarchical clustering can be further divided into
1. Agglomerative clustering
2. Divisive clustering
The partitioning clustering is divided into
1. K means clustering
2. Fuzzy C means clustering
Several algorithms cluster data differently, but we’ll focus on a simple and widely used algorithm: K-means clustering.
K-means clustering is a method that aims to separate data points into k clusters. Note that the parameter k is user-defined - we need to tell the algorithm how many groups are there in the data.
For example if the k = 2 which means there will be only 2 clusters. If the value of k=3 it means there will be 3 clusters.
Using the k means algorithm we can make clusters of data into different groups or categories. It helps us to understand the categories and classify the unlabeled data into these categories without using a training dataset or training the model.
K means clustering is based on the centroid that means every cluster has a centroid in the k means algorithm and the algorithm tries to reduce the sum of the distance between the data and its data cluster.
In this algorithm, it takes unlabeled data and makes that data into a number of clusters which is given by the user using the parameter K. This process gets repeated until it gets a perfect cluster.
The K-means algorithm has three general steps:
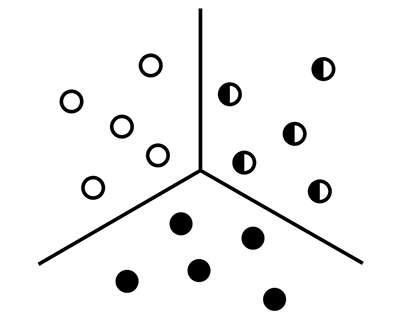
After that, we will get the clusters with data points that have common features. Show below is a representation of K-means clustering in action. The black + sign is the centroid that is randomly assigned initially. The black line represents the decision boundary: a rule that the algorithm has learned to separate data points into different clusters.
For each iteration, we are computing the distance between each data point and the centroid. After every iteration, the assignments to different classes change. The new cluster assignments change the centroid position, as we are determining a new center value of a given cluster.
After each iteration, the class assignments tend to stabilize as the algorithm finds the best separation between classes over time. This stabilization of model assignments is known as model convergence.
Now we have a basic idea of k-means clustering and how it works, now we are going to know in detail about how k-means clustering works.
STEP 1: decide the number of clusters we need using the parameter K
STEP 2: Select the centroids or some random points [ it doesn’t need to be from the dataset]
STEP 3: Add the data points to the nearest centroid that will come from the clusters.
STEP 4: Calculate the variance and make a centroid with respect to variance for each cluster
STEP 5: Reassign the data points to the new centroid and make a new cluster
STEP 6: In case of any reassignment, repeat from step 4
STEP 7: complete the model and be ready to get in use.
Detailed View of K means Clustering working
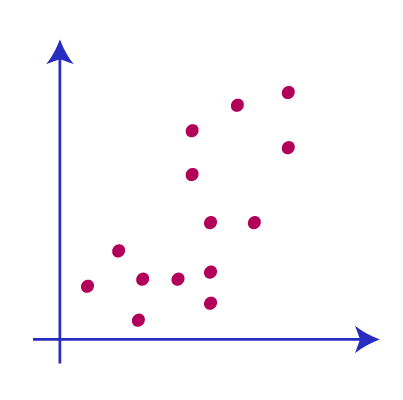
Consider we have two data variables s1 and s2. The graphical representation of these data variables is shown below.
Now we want to decide the value for parameter K which means we have to decide how many clusters, here we are providing k=2. Now we need to group these data points into these 2 clusters. For finding the value of k there will be different methods available.
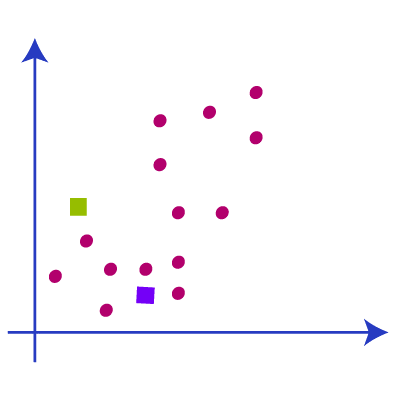
The next step is to determine the centroids, as of now we are just using some random k points as the centroids to make the clusters. These random points may be from the dataset or from outside any point. In the below picture we have selected the centroids different from the dataset.
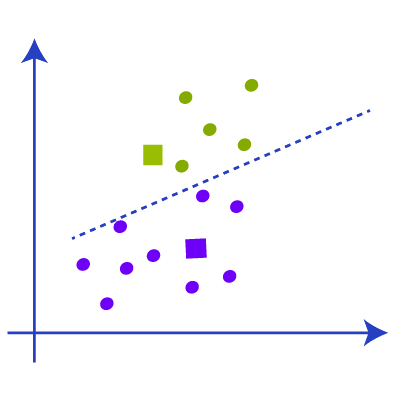
The next step is to assign the data points to this graph to the centroid or the k point. We are using the same formula that we use to calculate the distance between the points. After that, we have to draw a line in between the two centroids called the median.
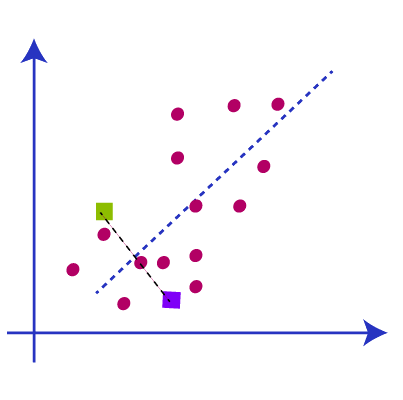
Now we have the median and we can understand from the picture that the points above the median are near to the green centroid and points below the median are near to the yellow centroid. So we change the color of data points to green and blue as per the centroid like this picture below.
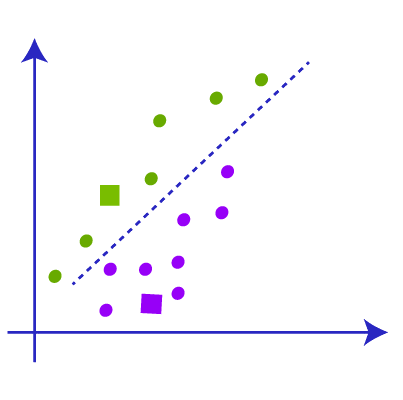
Now we have some points that belong to two centroids. Now we have to find the closest cluster so that we repeat the process and find a new centroid which will be almost the center of the centroid as in the picture.
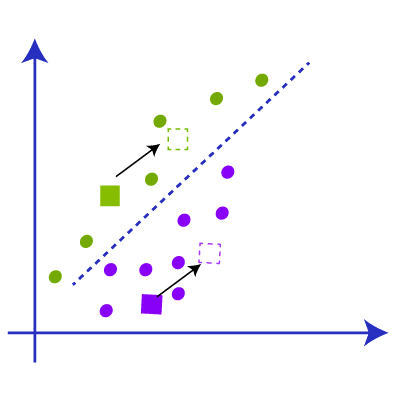
Now we got the new centroid and we repeat the process of linking the data points to the new centroid and draw the new median with respect to the new centroid like the picture below.
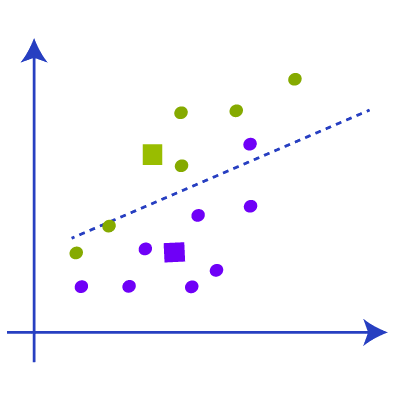
Now when we check the above picture we can find one yellow data point is below the new median and two green data points are above the median. So we have to link that data points to the respective new centroid like in the picture below.
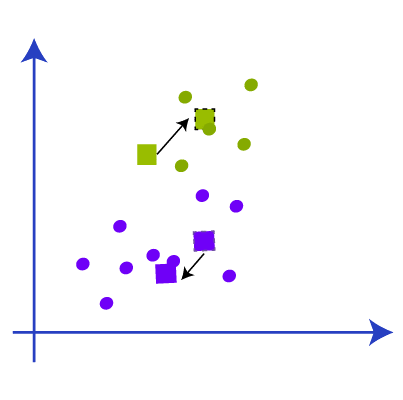
So after the re-linking with new data points with centroids, there will be a change in the center of gravity of the clusters and we have to repeat the step to find a new centroid with new data points. Like in the below image.
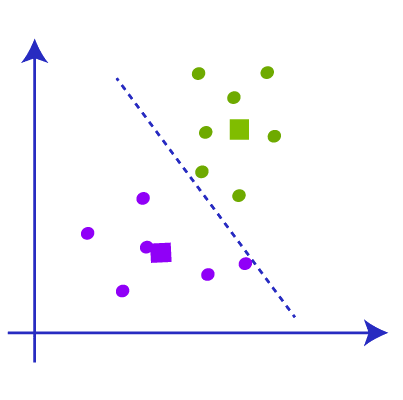
Again we have to find the new median with the new cluster and draw the median between the centroids like the picture below. We are repeating the above steps now.
Now when we check the data points there will not be any point that needs to reassign so the clustering is complete and our model is almost complete
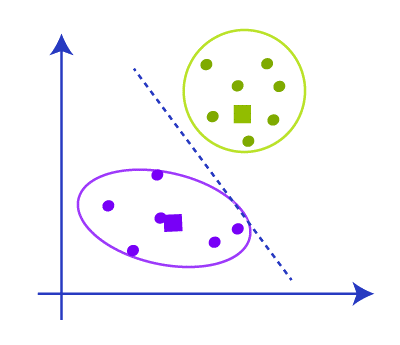
After forming the clusters we have to remove the centroids, median and all other structures we made to create the cluster and the final cluster will be like
K means clustering is fully dependent on the clusters and it will be very important in deciding the optimal number of clusters that will affect the accuracy of the model. There are many ways to find the k value were most important among them are
It is a popular and common method to find the optimal number of k values. This method uses the concept of WCSS that is the “within-cluster sum of squares” which uses the formula to find the k value.
This is used to calculate the WCSS value for 3 clusters.
K means clustering is an unsupervised machine learning method and it has a wide range of applicability in real-world and some of them are
K-means clustering is a powerful and intuitive way to separate data into groups. However, we make several assumptions about the data for K-means clustering:
The cluster sizes need to be the same size.
In the example above, Yellow is a lot bigger than Blue and Red, resulting in some misclassification.
The variance of the data or the distribution of the data points needs to be the same.
Again, Yellow’s spread or the variance is more spread out than for Blue and Red, resulting in some misclassification.
Finally, K-means tends to work better for “spherical” dataset relationships.
What this means in technical terms is that the variance needs to be about the same.
Finally, while we can use the number of actual classes to specify the hyperparameter k, we usually don’t know the number of classes in the data. In these cases, the k parameter can be challenging to determine in an unsupervised problem.