

Data frames are one of the most important as well as widely used reasons for starting to learn the R programming language. R is a statistical programming language that works with datasets. These datasets are comprised of observations or instances. All the observations have some variables associated with them.
Consider a data set of 6 students where each student is an instance and the properties relating to these students such as their roll number, names, grade, and section of the class to which they belong are the variables.
Now the question is how to store such information?
Can we use a matrix? no, because a matrix contains only elements or data of the same data type.
Here the roll number is numeric, the name is a character, and grade can be a character type that does not fit into a matrix but may fit into a list. A list can hold this information as a sublist with Roll_No, names, etc... But the structure of the list is not really fine to work with. One other limitation is in order to get any column need to write several R codes.
Then which data structure can overcome this situation, here comes the important and widely used concept of the data frame in R programming language.
In the R programming language data frame is a fundamental data structure that allows storing typical data in tables. A data frame is thus like a spreadsheet with rows and columns. In data frames, the rows correspond to observations while the column corresponds to variables. Each column can be a different vector.
The word frame represents a structure or a shape or a design or a pattern. So the meaning of the word data frame can be inferred as a structure/shape/design/pattern that outlines information regarding data or simply data organized in a well-defined frame.
Consider a spreadsheet or a table with data of a few school students with their roll number, name, and corresponding grade they scored in their examination. The column specifies the properties of each student.
Here, Rows = observations (students), Column = variables (roll number, name, grade)
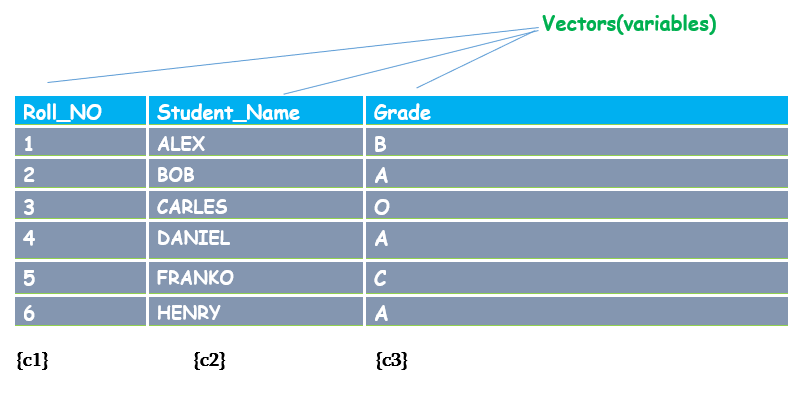
The same table can be represented in the R program with the data structure known as “Data Frame”. Each column of data can be of different vectors like numeric, character, etc. In the given student_table first column (c1) is composed of NUMERIC data type vectors, the second column(c2) and the third column (c3) consist of CHARACTER data type.
The data frames are similar to the list data structure. A list is consist of heterogeneous data elements or components listed in a list format where all vectors are of equal length. The data frame resembles a special case of a list except that the data are displayed in a frame. Like in the list a data frame also has vector components are of equal length.
It also seems to be similar to a matrix because of rows and columns. The big difference between a data frame with matrices is that a data frame can contain elements of different types one column can be characters, another may be numeric or logic that depends upon the requirements.
Still, in the data frame, there exists a restriction. The data type of all elements on a single or same column should be of the same type.
For example from the above table, you can identify the column with Roll_No variable has all elements of numeric data type.
Let us visualize the difference between a list and a data frame. To understand better the concept of the data frame in R.
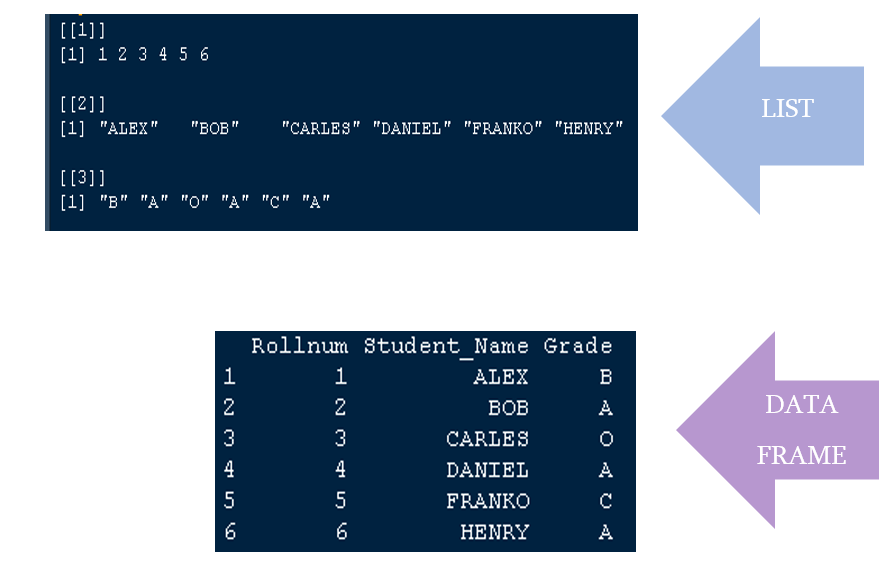
The same data as in the list is visualized in a tabular form in the data frame.
Now let us start our discussion with the practical part of R programming language by learning to create a data frame.
In R programming language you don’t need to create a data frame yourself instead you can import data from another source. The other sources can be a CSV file, a relational database (eg SQL) or can come from other software packages like EXCEL, SPSS, etc.
R also provides ways to manually create data frames. In R a data frame is created using a built-in function data.frame().For creating a data frame for 6 observations (rows)and 3 variables(columns) you need to pass the data frame function 3 vectors that are of the same length six.
data.frame()
The parentheses () enclose the vectors of any specified data type as parameters. The vectors such as vector1,vector2, etc are created outside the data.frame() function and these vector names are passed as parameters into the function parentheses.
<variable_name> = data.frame(<vector1><vector2><…………>)
Let us learn how to create a data frame for the above mentioned student_table.
The table consists of three columns (c1, c2, c3). Column c1 is the Roll_No of students in the table. Create a vector for Roll_No in c1. As we know a vector is created using the c() function.
Column c2 is Student_Name which is of character datatype like ALEX, BOB, etc and c3 is Grade of students of character datatype like B, A, and so on. Each column represents vectors (variables) and rows represent observations. You can infer some valid relation between each column and row values.
Roll_No = c(1,2,3,4,5,6)
Student_Name = c("ALEX","BOB","CARLES","DANIEL","FRANKO","HENRY")
Grade =  c("B","A","O","A","C","A")
D = data.frame(Roll_No, Student_Name,Grade )
The data frame is created which contains vectors Roll_No, Student_Name, Grade, and assigned to a variable D.
The steps you need to proceed with for creating a data frame are
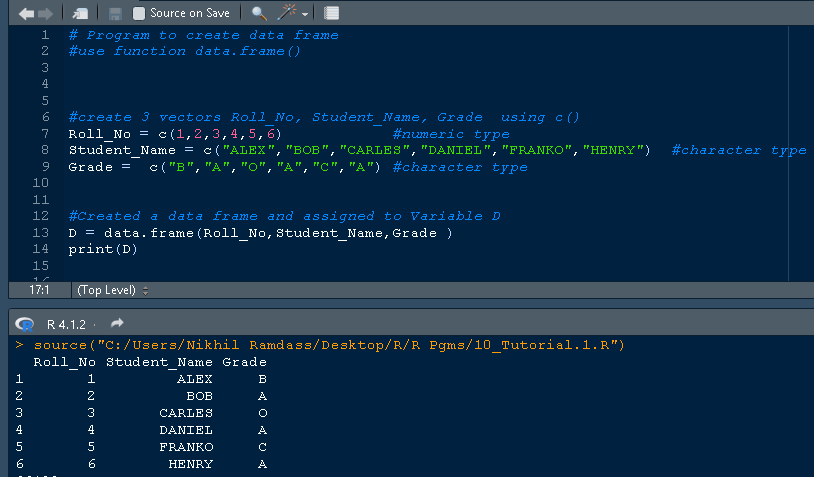
The full source code for creating the data frame for student_table is given below.
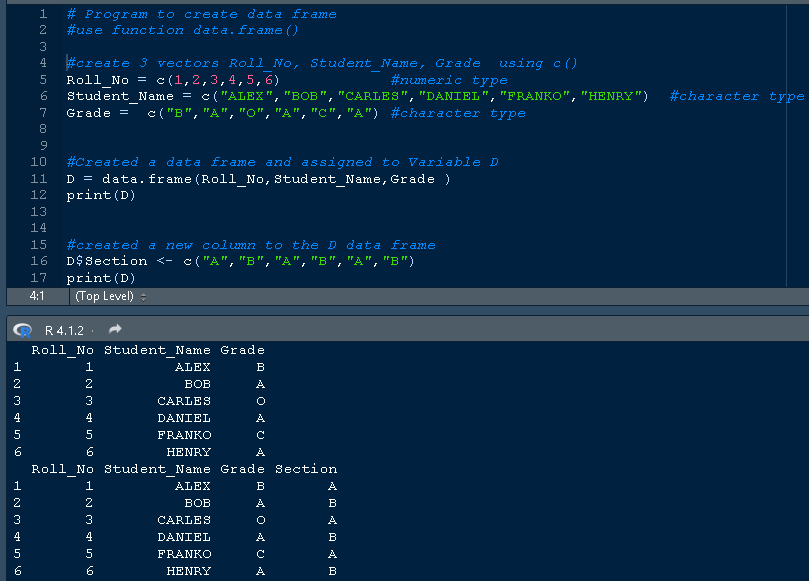
#create 3 vectors Roll_No, Student_Name, Grade using c()
Roll_No = c(1,2,3,4,5,6) #numeric type
Student_Name = c("ALEX","BOB","CARLES","DANIEL","FRANKO","HENRY") #character type
Grade = c("B","A","O","A","C","A") #character type
#Created a data frame and assigned to Variable D
D = data.frame(Roll_No,Student_Name,Grade )
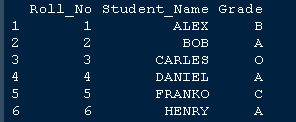
print(D)
Output:
  Roll_No Student_Name Grade
1    1            ALEX     B
2    2             BOB     A
3    3          CARLES     C
4    4          DANIEL     A
5    5          FRANKO     C
6    6           HENRY     A
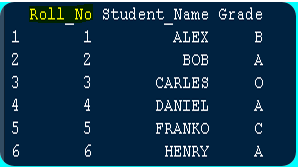
The snippet of the same code in RStudio is
Note: The length of three vectors Roll_No, Student_Name, Grade are of the same length.
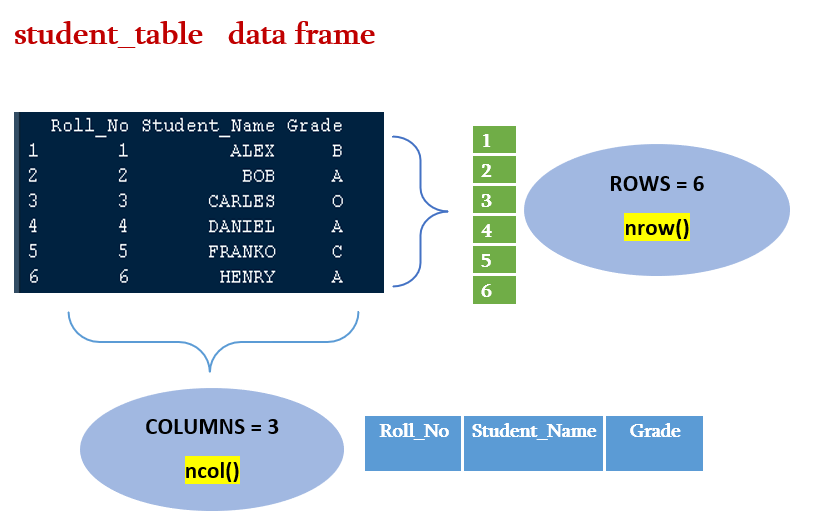
The number of rows and columns in a data frame can be calculated using the following syntax
nrow()
The parentheses contain the name of the variable to which the data frame is assigned. In our previous examples, we stored the data frame of student_table in variable D. Let us check the numbers of rows in student_table,
> nrow(D)
[1] 6
The nrow(D) returns a value of 6, which denotes there are 6 rows in the table.
ncol()
To calculate the number of columns inside a data frame use the ncol(), the parentheses contain the name of the data frame whose number of columns needs to be checked.
Let us check the number of columns in our student_table,
> ncol(D)
[1] 3
You can see number 3, the function ncol() returns a value 3 which states there are 3 columns in our data frame D.
Both the row and column numbers can be calculated using a single function.
dim()
Let us check the output of the number of rows and columns for student_table,
> dim(D)
[1] 6 3
The function returns the number of rows(6) followed by the number of columns(3).
The R programming language has built-in function names() that support setting and getting the name of R data frame components such as the name of a column. The names() function is a generic function to access the name attribute of R objects.
In our vector, matrix tutorial we discussed the names() function where we assigned values as names to the vector, matrix data structures.
Here names() function gets the name corresponding to a column number. The names() function encloses the name of the data frame you created from which the name needs to be accessed along with mentioning the column number inside the square bracket [ ].
names()[]
In our previous session, we created a data frame D with three vectors, these vectors form the columns in the data frame with values of vectors as rows.
Consider the student_table, the names(D) function checks the data frame with the name D followed by evaluating the column number of D specified in [ ] as 1. The function evaluates [1] as the first column in the data frame D and returns the name Roll_No.
> names(D)[1]
[1] "Roll_No"
The names()[] gives the name of a column in the data frame
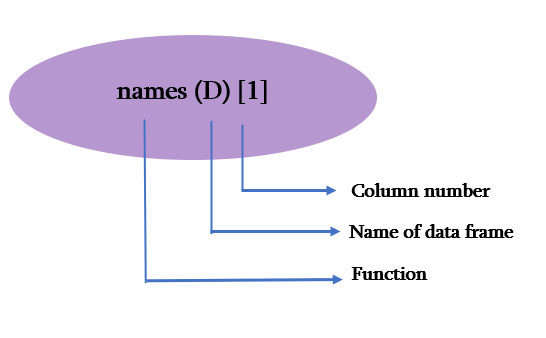
The corresponding name of the column retrieved is Roll_No. You can observe the output from the image to get a better idea of names().
The head() and tail() function are built-in functions in the R programming language that helps a user to view the output data based on their preference. In some cases, if a large dataset or database is imported into your R program, it may contain many columns and rows. In our student_table example, there are only 3 columns and 6 rows which are easy to observe and make our inferences.
But that is not the case with a huge database, so the user can view the initial set of databases (very top) using head() function and a final set of databases (very bottom) using tail() function.
head(<name of data frame>)
head(<name of data frame>)
The structure of a data frame can be found by using a function known as str().
str(<name of data frame>)
Let us check the structure of our student_table, the D data frame created above using the str() function
str(D)
The function str() to determine the structure of data frame D returns the following observations as output.
This is the structure of a data frame with 6 observations of three variables. The three variables are Roll_No, Student_Name, and Grade. Further, it provides the details such as variable Roll_No is of numeric data type (num) with following observations such as 1,2,3,4,5,6.
The variable or vector Student_Name is of character data type (chr) with the following observations as "ALEX" "BOB" "CARLES" "DANIEL" ...
The last one is Grade a vector of character type(chr) with observations "B" "A" "O" "A" ...
Output:
'data.frame': 6 obs. of  3 variables:
$ Roll_No     : num  1 2 3 4 5 6
$ Student_Name: chr  "ALEX" "BOB" "CARLES" "DANIEL" ...
$ Grade       : chr  "B" "A" "O" "A" ...
>
The summary of an R data frame is found using a built-in function in R known as the summary() function.
summary(<name of data frame>)
The function name summary is followed by the names of data frames inside the parentheses (). Remember the data frame D we created using data.frame() function
#create 3 vectors Roll_No, Student_Name, Grade  using c()
Roll_No = c(1,2,3,4,5,6)            #numeric type
Student_Name = c("ALEX","BOB","CARLES","DANIEL","FRANKO","HENRY")  #character type
Grade =  c("B","A","O","A","C","A") #character type

#Created a data frame and assigned to Variable D
D = data.frame(Roll_No,Student_Name,Grade )
print(D)
The resulting output is a table format as shown in the snippet
Now let us check the summary of the same data frame D using the summary() function provided by R.
summary(D)
Where summary is the function name and D is the name of the data frame we created. Let us see the output produced by the above syntax
Output:
> summary(D)
    Roll_No     Student_Name          Grade
 Min.   :1.00      Length:6                  Length:6
 1st Qu.:2.25    Class :character       Class :character
 Median :3.50   Mode  :character   Mode  :character
 Mean   :3.50
 3rd Qu.:4.75
 Max.   :6.00
The same result in RStudio is shown by snippet for a better understanding of the D data frame summary.
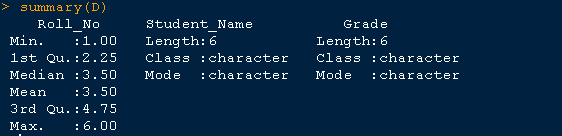
The summary shows that
Similarly, the summary for both vectors Student_Name and Grade is
To add a column in the R data frame the syntax given below is followed.
<name of existing data frame> <$><name of new vector> = c(<value1>,<value2>………)
Let us see the syntax with our D data frame we discussed in the above sessions
D$Section <- c("A","B","A","B","A","B")
Or Secti
D Secti
To the data frame D a new vector is added (section), the section is a vector with values “A” and “B” created using c().
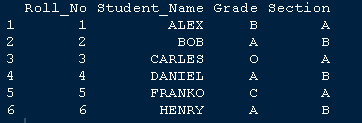
Let us see the output after adding a new column section to our data frame D.
Output:
        Roll_No Student_Name Grade Section
1       1         ALEX     B       A
2       2          BOB     A       B
3       3       CARLES     O       A
4       4       DANIEL     A       B
5       5       FRANKO     C       A
6       6        HENRY     A       B
The snippet for the same piece of code is
From the snippet, you can infer the new column section. The initial set of data represents the old data frame D with 3 columns only and just below that, you can view the same data set with an additional column section. It is clear the new data frame now contains 4 columns such as Roll_No, Student_Name, Grade, Section.
In order to identify the number of columns use ncol() function which we learned in our previous session of the same tutorial.
Let us see the number of columns in the new D data frame
> ncol(D)
[1] 4
>
The cbind() function also works in adding column.(Refer matrix tutorial to review cbind())
cbind(D,Section)
The output after using cbind() function is adding the column named Section as shown in the below snippet.
There are two subsetting techniques included in R to subset the data frames.
Consider the new data frame D we created with 4 columns and 6 rows in our just above topic.
Let us start by selecting single elements from the data frame.
Suppose you need to select the name of a student with Roll_No 5 at the fifth row of our data frame. We subset using a single bracket [.The name of the data frame(D) followed by a single bracket[ with parameters representing the observation(row index) number (5) comes first and then second comes column number(2).
Let us see the syntax with an example
Data.frame_name[nrow,ncol]
D[5,2]
[1] "FRANKO"
We get the student name “FRANKO” by mentioning the row and column number from the data frame. Giving the column name instead of the column number also produces the same result as shown below
> D[5,"Student_Name"]
[1] "FRANKO"
D[<nrow>  , ]                    #to subset entire row
D[ ,  <ncol>]                    #to subset entire column
To retrieve or subset all information of “FRANKO” you can use the below code
> D[5,]
  Roll_No Student_Name Grade Section
5       5       FRANKO     C       A
The result is a data frame with a single observation.
Now to get Student_Name the syntax D[ , <ncol>] will work.
> D[,"Student_Name"]
[1] "ALEX"   "BOB"    "CARLES" "DANIEL" "FRANKO" "HENRY"
The result is like a vector because columns contain elements of the same data type.
> D[c(2,5), c("Student_Name","Grade")]
  Student_Name Grade
2          BOB     A
5       FRANKO     C
The row number or observations are provided with c() and column names are given next inside c() to get the values corresponding to the row and column.