

R is a programming language and free software introduced in 1993 by Ross Ihaka and Robert Gentleman primarily used for statistical computing and graphical visualization. R is the language of Data Science. Data Science in simple terms is a field of study that deals with massive data and its analysis to draw the inference on unseen patterns, meaningful information, etc. Before going deep into R let's understand statistics and its significance in the modern era.
Statistics is a mathematical discipline that facilitates the collection, analysis, interpretation, presentation, and summarization of data. The data can be any facts that can be expressed in numbers or tables or charts or any type of classified arrangement. For instance, the population of a country or the economy of a country is determined with the help of statistics.
The scope of statistics is extensive. You can see the use of statistics everywhere - agriculture, food industry, genetics, psychology, sociology, manufacturing, business, pharmaceuticals, weather forecasting, etc.
To understand the relationship between statistics and programming language let go back to our earlier classes where we have learned the basics of statistics. The basics we familiarize areas mean, median, mode, etc. By definition, mean is the average of n numbers. It is easy to find the mean of 10 numbers, but the case is different if you need to find the mean of 1000 or more numbers. In such situations where a calculator is beyond the limit, a computer application is really needed.
So here comes the involvement of the programming application and programming language in statistics to deal with Data Science. To process the complicated calculations, either a preprogrammed code or a customized programming code is essential and to write a programming code you should have to be acquainted with programming languages. This is the reason why statistics students or Research & Development students have programming papers in their syllabus.
We have plenty of statistics software available to deal with Data Science. Some of the common statistics software are listed below.
If you are interested to know more about different statistics software refer to the List of statistical software.
Among this statistical software: SAS, MATLAB, Maple, Python, R are programming languages containing statistical features. This statistical software can easily customize its output as needed by writing new codes or modifying the existing code. This enables more user-friendliness and convenience to the users.
“R is a dialect of S” means R is another version of S. So let’s start our journey by understanding what S is? S is a programming language developed by John Chambers at Bell Laboratories in 1978 to compute statistical analysis. It was initially designed for internal use only. Later in 1988, they upgraded the S system by rewriting the codes to C from Fortran and by incorporating new features and providing them to the public. But the '90s and later times were not favoring the S language and moreover, S language was available only in its commercial version S-PLUS which limited its access to common people.
Coming back to R, R is a programming language and environment created by Ross Ihaka and Robert Gentleman, in 1991 at Auckland University, as a part of their research project. They relied mostly on S language and have included many features of S in the R however adhered to create a different version of S. In 1993 both Ross and Robert announced their first creation to the public and in 1995 by Martin Machler's influence they made R a free and open-source software by using the GNU General Public License. Then in 1997, the R core group was formed and later, CRAN ( Comprehensive R Archive Network)was founded. Eventually, they released their first version R 1.0.0 in 2000.
To understand the history of R programming in chronological order please refer to The History of R.
Now the world is working around the clock analyzing big data. From university to industry the big data has high significance and the best tool to manage big data is the statistical computing environment like SAS, SPSS, Python, R, etc.
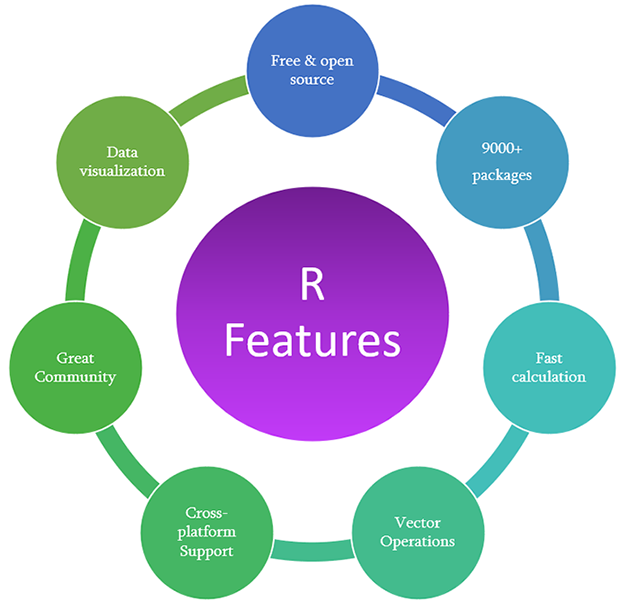
Recently R programming is gaining more popularity than it has in previous years and is rising to the top index. Why is R so popular? What makes it so demanding? Yes, here we are discussing some of the distinctive features of R programming. They are:
The scope of R programming is secure as R itself has turned out to be the best elemental tool for data analysis. Now in this trending world most of the big companies like Google, Amazon, Facebook, Microsoft, Ford Motor Company, etc, and data scientists and statisticians are relying on this powerful analytical tool because of its simplicity and other stunning features which we have discussed in earlier sections. Here I will give you an insight into the career opportunities of R programming to give a positive influence on your decision to take up with R programming.
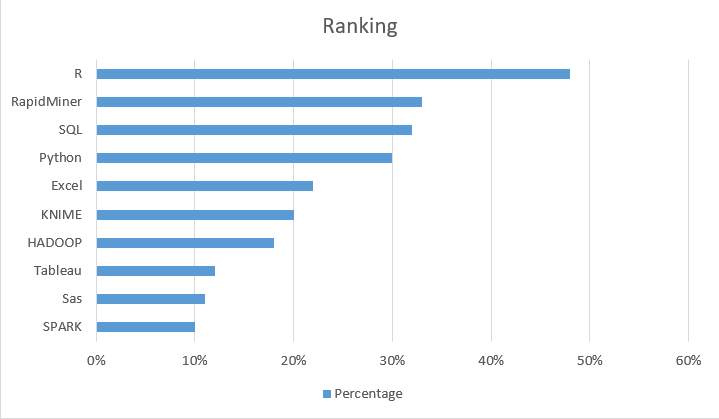
R is 50% more in use than Python based on its survey which makes R a more suitable language for data science
Though it is a trending language now, it has a huge impact on creating new promising career openings for the upcoming and existing generations. An interesting fact is that it is not limited to a specific domain. Let’s have a glare at them:
Some of the trending career positions for R programmers are listed below:
DataScientist: Data Scientists are analytical experts who gather and analyze a large set of both structured and unstructured data, interpret and then create a result for companies or organizations.
Data Analyst: Data analysts are professionals who gather and extract the most sufficient data and then analyze it to create an insight that helps the organization to take an accurate decision.
Business Analyst: As per Wikipedia,”A business analyst is a person who analyzes an organization or business domain and documents its business, processes, or systems, assessing the business model or its integration with technology.”
Data Visualisation Expert: Data Visualization Experts are those who possess high visualization and designing skills to convert the outcome of the analysis into a report containing visual representation like graphs, charts, etc rather than representing raw data.
Quantitative Analyst: Quantitative analysts are those who help the organization in making decisions on risk management, investments, costing, etc by deploying complex mathematical models. They should have sound knowledge in finance despite their technical skill.
These are some of the career options that R programming is utilized. When coming to the remuneration part, R programming is promising a good salary package beyond your expectation. By all means, learning R programming is worthy.