

Logistic regression is one of the most simple and basic machine learning algorithms that come under the supervised learning classification algorithm that helps to determine the predicted variable into a category using the set of input or independent variables.
We can say the logistic regression is used when the predicted value is binary in nature which means if that predicted variable comes only under any of two categories like yes or no or 0 or 1. But in some cases, it gives a probabilistic value that is between 0 and 1.
Logistic regression is used to predict the probability that is much similar to the linear regression in regression algorithms. The only major differences are how they are used as the logistic regression is used for classification problems where the linear regression is for the regression type.
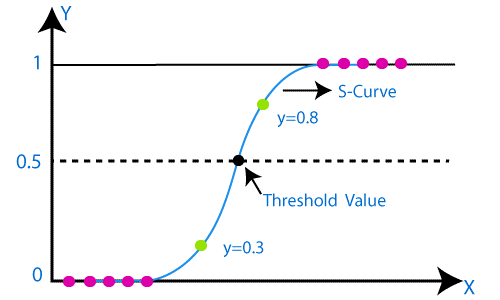
Different from the linear regression whose graph is a straight line, logistic regression graph tend to be in a shape of a alphabet “s” between the values of 0 and 1. From that curve in logistic function we can understand whether it is a spam or not, or it is a fraud or not.
Based on the number of categories and the predicted variable we can divide the logistic regression into three types. Normally as we discussed above the logistic regression has binary values but has 3 types inside.
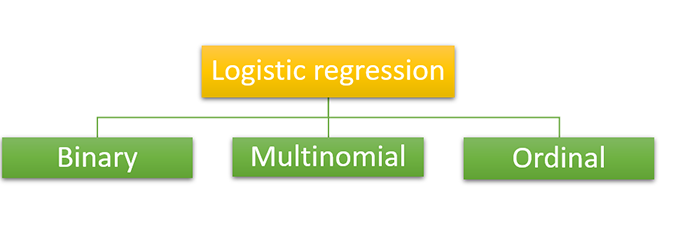
As we know in binary classification, the predicted variable will have only two possibilities either it will be zero or it will be a one. It will be like a yes or no condition that can be used in detecting spam or not spam.
In multinomial type classification, the predicted variable may have the probability of three or more outcomes that will be type A or type B or type C or like that, and there will be no relation or dependency between the categories. It is used to make different categories like shapes or colors or fruits like that.
It is also a multinomial classification like the predicted variable may have three or more outcomes but the category for the outcomes will be ordered which means they have a strong relation or dependency. For example, consider the grades of the students’ category like good, very good, and brilliant. All three mutually have quantitative significance.
We have two important assumptions for the smooth working of logistic regression else it may cause inaccurate or error results. They are
As we learned in our previous topic about regression the same steps are using in the logistic regression implementation that is
Up to this point, you may be wondering if we can use linear regression for classification tasks. After all, one way to frame a classification task would be to identify the best line that separates different classes.
However, linear regression tries explicitly to identify a trend that describes the relationship between data rather than the best separator for classes. Thus, linear regression is not an appropriate classification method due to the following reasons:

Logistic regression solves this problem by attempting to compute the probability that a data point belongs to a given class. It is a useful model for solving binary classification problems.
Let’s suppose that we are 80% sure (p=0.8) that a given data point belongs to class A. The odds of us being successful is p/(1-p)=0.8/(1-0.8)=4. This means that our odds of success are 4:1, and the higher the odds, the greater the likelihood for a given outcome.
However, in theory, odds can assume any number between 0 and ∞. This makes it really hard to come up with some rule for classifying a given data point. Thus, we need a better metric to perform classification, and one intuitive metric is to use a probability.
To model a linear equation in terms of probability, we need to perform the logit or sigmoid function. We take the log of the left-hand side of the equation, which we assume to be the odds of success.
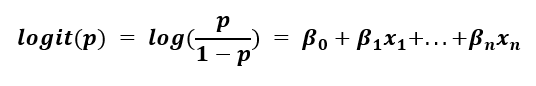
The left-hand side is known as the log-odds and has a range of -∞ to ∞. This is essentially the linear regression problem in terms of probability: the output of the model can be any value under the sun, which is not useful for a classification problem.
However, in logistic regression, we solve for the probability that the data point belongs to a given class. If we work out the algebra, we get the following expression:
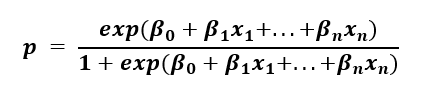
This form ensures that p is within the range of 0 to 1, which is what we need for a binary classification task.
To interpret the model results, if the probability that the data belongs to class A is less than 50%, which is equivalent to a random assignment (p<0.5), then we can say that the data point should be classified as class B.
Let’s compare linear regression versus logistic regression, given the same data. Class A has P = 0, while Class B has P = 1, and it’s plotted as a function of x.
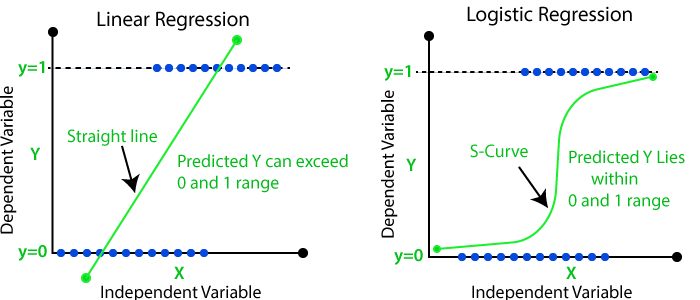
For both of these reasons, we can safely say that the linear regressor is not an appropriate method to classify the data two classes and separate the data by a line. In contrast, the logistic regression curve does this perfectly. Additionally, it is highly interpretable: the line visualizes the probability a given data point belongs to a class as a function of x.
While logistic regression is a valuable and straightforward algorithm to perform binary classification, the same assumptions we had to make in linear regression still apply in logistic regression.