

Regression analysis is a simple method to show some relation between the single predicted value that we can call a target and the multiple predictor values.
Here the target variable is dependent on the input predictor values, but the input values are independent. We can use regression analysis if the value of the target is a continuous value like salary, age, or weight. In addition, we use it in
For better understanding let us simplify the regression analysis as it will show us how the value of a target is changing that is dependent on the input values with changes in any one input value where the other input values are the same.
Let us consider an example of an IT company data of continuous five years about the number of employees and the total turnover of the company.
| Number of employees | Total turnover |
|---|---|
| 100 | $20000 |
| 200 | $60000 |
| 300 | $100000 |
| 400 | $140000 |
| 500 | $190000 |
| 700 | ? |
The above table contains the data of the number of employees and the company turnover. As it is an IT company the employees are the resources and an increase in the number of resources will increase company turnover.
Now the company is planning to increase the employees and they want to know the total turnover of that year. In such cases, we can depend on the regression analysis for the best prediction.
Here regression will analyze the input variables (in our case it is the number of employees) and make a relation in between the variables and it predicts the output which will be continuous and real, based on these input variables.
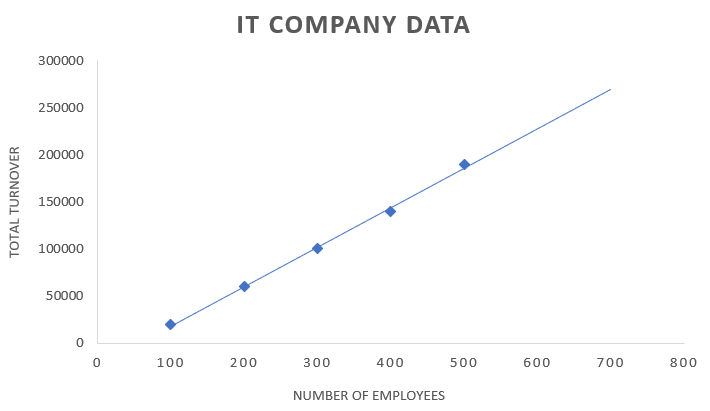
We use the graph to show the regression using the input and output variables as data points. Regression will be a line or a simple curve that is passing through the data points in this input-output variable graph with a minimum distance with the data points. This distance between the regression line and data points can tell us the model got the relation between the input and output variables.
As we understand the regression analysis we all have a question in our mind why we need regression analysis? In this modern world, we can see many real applications that need an accurate continuous prediction depend on the input variables and can able to predict how the change in the input variable affects the output prediction.
Let us take the stock market we can easily identify the stock trend, which helps to invest. Consider a company, which can use regression analysis for predicting future market sales with the previous data and the changes. Like that weather forecast, economy forecast, and many applications are there that use the regression analysis.
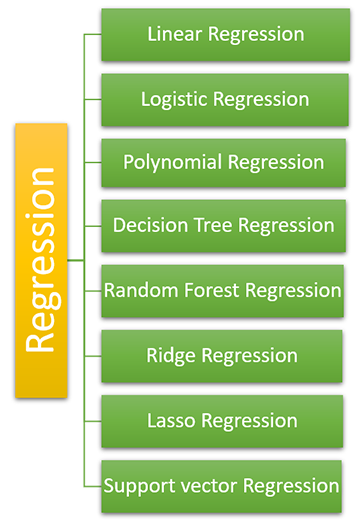
There are various types of regressions we are using in machine learning, which have different characteristics and importance. We have to select one depends upon the data and our needs, they are
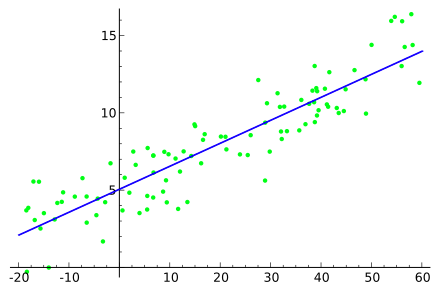
Linear regression is the basic type of regression in machine learning. It uses the statistical method for the prediction. Linear regression contains an input variable that we represent as the X-axis of the linear regression graph and the target variable that we represent as the Y-axis. Linear regression makes a line in the regression graph.
In linear regression, if there is more than one independent variable is present then we call it multiple linear regression.
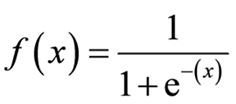
Linear regression is expressed by the equation
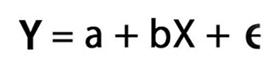
The applicability of linear regression is
Logistic regression is another type of regression analysis method that works on the concept of probability, which we used if we need to solve a classification problem. It means the output variable of logistic regression will be binary value ‘0’ or ‘1’.
Logistic regression works with the problems that need to be classified such as true or false, yes or no, spam or not spam like that.
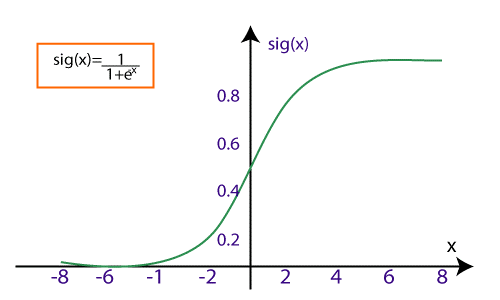
In logistic regression, we use a sigmoid curve to represent the relation between the input (independent) and output (target) variables. We represent the logistics regression as
Where,
Finally, we have to provide the input variables which produce a shaped curved graph.
We can divide the logistic regression into 3 types that are,
Polynomial regression is very alike to multiple linear regression with some modification. In a polynomial graph, the relationship between the input and output variables will be denoted by an nth degree, which means polynomial regression is represented by a nonlinear curve between the values X and the Y-axis.
Consider a dataset with some data points plotted in a graph in a nonlinear fashion, in such a case, the linear regression method will not work properly. There we need a nonlinear curve to connect all the data points that is called the polynomial regression.
In polynomial regression, the real features are converted into polynomial features with some degree which we mentioned as nth degree and fitted with the polynomial line.
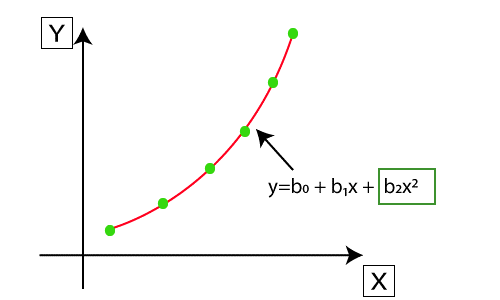
We represent the polynomial equation as

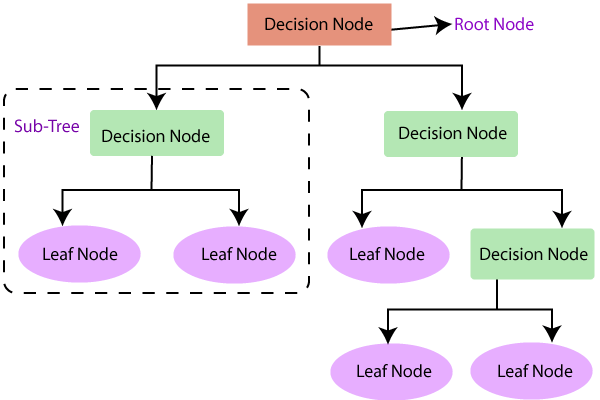
Decision tree regression is a tree structure, which can be, used for both classification and regression types. As we know decision tree structure has the internal nodes, branches, and the leaf which all are used for the problems both category and number data.
Decision tree structure
As we all know it is like a tree structure that starts with the root dataset and split into the left and right child node that represents the subset of the parent dataset. Again it split into their children making them parents. A decision tree is drawn below from a clear understanding.
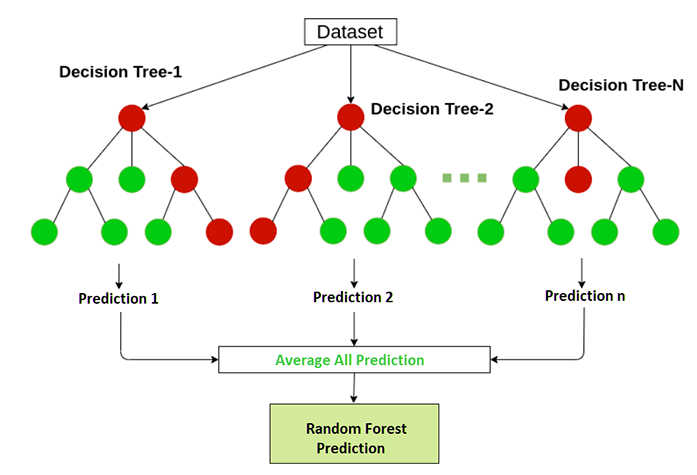
It is a more complex regression method, which combines more than one decision tree regressions. Random forest regression is a very powerful algorithm that can be used for both classification and regression jobs.
Random forest regression predicts the output by combining decision trees and by the average of each tree result. Decision trees used in the random forest regression are termed, base models. A random decision tree can be represented by the formula
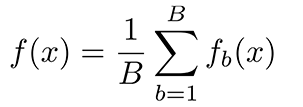
that is g(x)= f0(x)+ f1(x)+ f2(x)+....
Random forest regression is helpful to prevent the problem called overfitting in the model.
Ridge regression is one of the flexible and powerful regression analysis which is used when there is a high correlation between the input variables. If the co-linearity is very high, we will add some bias into the ridge regression method. The amount we add in the bias is called a penalty in ridge regression. Ridge regression has less susceptible to the overfitting problem.
We can represent Ridge regression using the formula
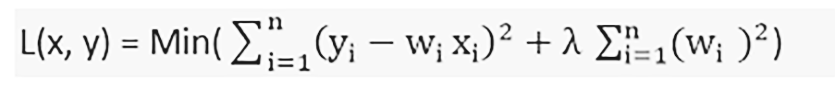
Ridge will help to solve problems with a large number of parameters and have a high correlation between them. Ridge is also used to reduce the complexity of a model that we call L2 regularization.
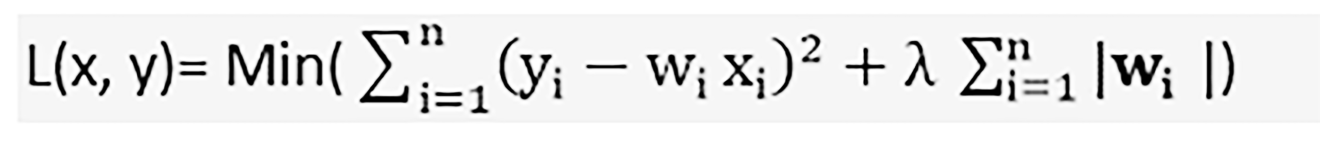
Like the Ridge regression, Lasso regression also used to reduce the complexity of the model by adding some penalty. The only difference is we add the actual amount to a penalty in Lasso, as in ridge we use a square of the amount.
Lasso regression can shrink to an absolute zero value. Lasso regression is also called L1 regularization, which is represented by
Support vector regression can be used for both regression and classification algorithms. If we use it for regression, we call it as support vector regression. Support vectors use the continuous input variables.
In support vector regression, we are trying to find a line that will reach almost all the data points and predict continuous variables called hyperplane with maximum margin.
The aim of the support vector regression is to make a boundary line with the hyperplane that covers a maximum number of data points.
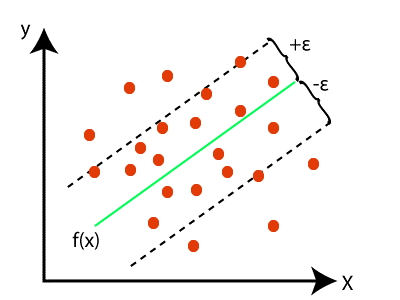
In this graph, the green line represents the hyperplane and the dotted lines represent the boundary lines with respect to the hyperplane. Red dots are data points.